|
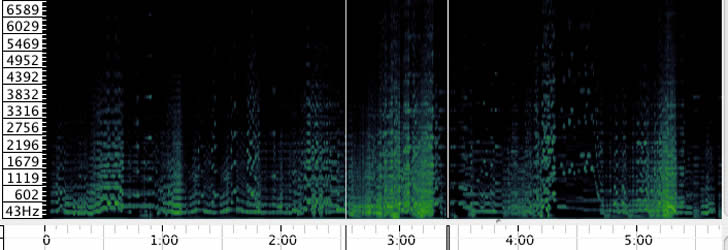
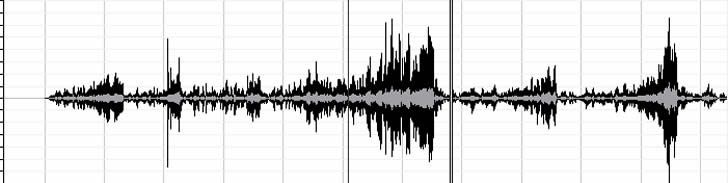
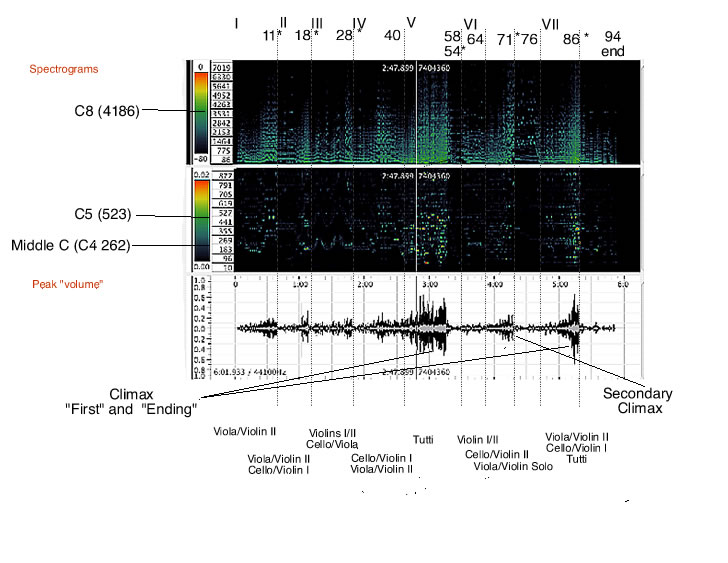
Sonograms Sonograms are plots of musical events in respect to time. Under this very loose definition music scores can be considered to be a sonogram, but here we consider sonograms of a particular type: the spectrogram (an example to the right) and the (amplitude) wafeform. The spectrogram is just a plot of frequencies vs time. It is nowadays obtained using some pre-made software (I use Sonic-visualizer, http://www.sonicvisualiser.org/) and it looks like this: This is the spectrogram for Britten Op. 92, first movement. In the figure on the vertical axis we have frequency (in Hz), the horizontal axis is time (minutes) and the brighter is the "green" in the plot the "loudest" is the corresponding frequency. One can immediately see two advantages in the representation: (1) the whole composition (lasting close to 6') is condensed in one small graph, that gives an eagle-like view comparable to looking at a planimetry of a building, (2) the actual sound in captured including not only the fundamental frequencies, but all the harmonics "the timbre" of the sound as it unfolds. Of course Spectrograms have problems and there has been much discussion about the benefits of a spectrograms for music analysis. As every tools it does has limitations, but certanly modern software is increasing its utility, especially when combining playback features, zooms and offering different types of spectrograms. For pioneering work in the field see: Cogan, R. New Images of Musical Sound (Harvard University Press, 1984).The amplitude wafeform is a simpler plot, lously speaking it shows the "volume" vs time. For the same piece it looks like this: In this graph the wider the trace on the vertical axis, the loudest is the overall volume of the corresponding sound. A very nice plot to quickly identify climaxes and in general dynamic features. When combined with some music analysis sonograms can provide very usuful information. The following is a sketch for an analysis of the Britten. Here sonic events are mapped to the score (the arab numerals at the top are measure numbers) and so are sections in the piece (the roman numerals at the top). That is: the sonic picture (the foreground) provides direction for the more detailed analysis that will investigate (perhaphs with the aid or additional scaled down sonograms) the finer details of the composition.
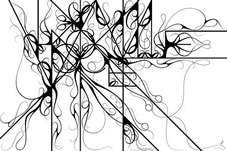
spectrogram and waveform
 |
||
|
