|
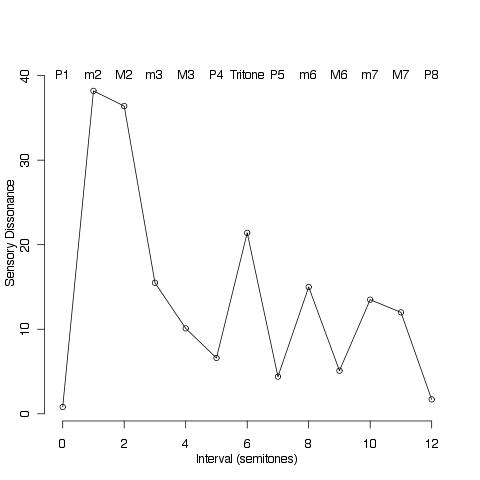
The distinction between dissonance and consonance seems to be a central feature of our auditory system. Humans, as any music teacher that has worked with children observes, can quite distinctly differentiate between intervals that, roughly speaking, sound pleasant or consonant and intervals that sound unpleasant or dissonant. A number of studies have actually measured the sensory dissonance associated with musical intervals and attempted to build models to rationalize the observations. Figure 1 below, for example, shows the data collected by Vassilakis [1] (p. 210, table 6.15; average data collected from ten adult volunteers). The base frequency is 261.63 (Hz, corresponding to C4), and each sound in an interval is generated using 6 harmonic components (with frequency 1f, 2f, ..., 6f) and amplitudes 1,1/2,1/3,1/4,1/5,1/6. The observed sensory dissonance (in arbitrary units) is plotted against the musical interval. From the graph it is quite clear that certain intervals (minor/major second, the triton, minor sixth, minor and major seventh) are much more dissonant than minor/major thirds, and that perfect fourth and fifth and major sixth take a special place as the most consonant intervals after the octave. There are quite a few observational results in the literature confirming this pattern of perception. The studies actually confirm by measurement patterns of perception that has been known since antiquity: octave and fifths intervals dominated religious music writing for centuries for a reason! It is interesting that relatively simple mathematical models for sensory dissonance mimic observed patterns of sensory dissonance. Figure 2 duplicates the results obtained by a model reported by Sethares [2], using some ad hoc coding in the R language. The model basically sums up the interference in the harmonic components of the two pitches making up a particular interval. The figure reported below is obtained assuming that each pitch of the two notes interval is made up of six harmonic components of the same amplitude. i The model of Sethares qualitatively follows the data reported in figure 1, clearly indicating a complex pattern of dissonance that emerges by simply considering harmonics interference. Note how the most dissonant interval is smaller than the m2: positioned somewhere in between the unison and the m2 the highest dissonance is related to the natural phenomenon of Beats Interference (the major physical phenomenon used to tune Piano unisons). The model can be used to, for example, show the pattern of sensory dissonance over and extended interval range. Figure 3 reports the sensory dissonance curve for an interval of 4 octaves, with the interval ratio in log scale. Only octave interval ratios (2,3, ...) are marked on the x-axis. The figure shows an example of dissonce "decay": the "same" intervals separated by multiple octaves is perceived as less dissonant. A minor 2nd and a minor 16th can be considered to be the same interval (due to octave equivalence they are in the same interval class), but, according to the figure, they have actually very different sensory dissonace value. As pointed out by Mashinter [3], the model of Sethares is however not very accurate, in particular underestimating the observed dissonance of certain intervals. Figure 4. shows the observed dissonances (open circles) reported in figure 1 with superimposed predictions obtained by the model scaled to span the same range of the observations (solid line, amplitudes are now the same used for the stimuli to the volunteers: 1,1/2,1/3,1/4,1/5,1/6). Figure 4. Predicted and Oberved Dissonances. Note how the dissonances are often underestimated (in particular A4, m6, m3, M3, and P4).The figure below shows a first adaptation of the model that takes into account the extra dissonance associated with the triton. (The fit is accomplished using techniques described in [4].) Figure 5. Predicted and Observed Dissonances, modified model. Next in the ongoing investigation will be (1) refining models for sensory dissonance and (2) formulating a quantitative calibration of consonance and dissonance that can be used as a compositional tool. An underpinning is to revisit two main 20th century concepts, born in the atonal and especially twelve-tone schools. The first is that of octave equivalence (and interval class), and the second that dissonance is actually emancipating (a concept in turn associated with the 19th century concept of musical progress). The two concepts contributed to the idea that a composer can use any interval or combination of tones as functionally equivalent (which is fine and good but should probably just best considered as an option). Musical considerations and theoretical work should show that no two intervals are born equal, and that a careful, now possibly quantitative, calibration of consonance and dissonance is a powerful and quite central element of the grammar or music. REFERENCES [1] Vassilakis, P.N. (2001). Perceptual and Physical Properties of Amplitude Fluctuation and their Musical Significance. Doctoral Dissertation. University of California, Los Angeles. [2] Sethares, W. A. Tuning, timbre, spectrum, scale. 2nd edn, (Springer-Verlag, 2005). [3] Mashinter K.. Calculating Sensory Dissonance: Some Discrepancies Arising from the Models of Kameoka & Kuriyagawa, and Hutchinson & Knopoff. Empirical Musicology Review, p. 65-84, Vol. 1, No. 2, 2006. [4] Shujie, M. & Yang, L. A jump-detecting procedure based on spline estimation. Journal Nonparametric Statistics, 23, 67-81 (2011). :
Dissonance & Composition

 '
'
Figure 1. Observed sensory dissonance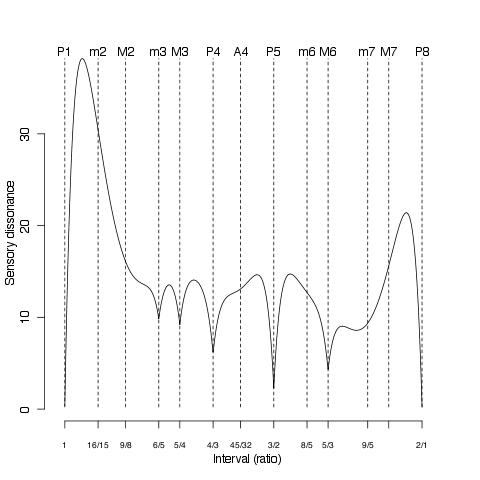
Figure 2. Predicted sensory dissonance using the mathematical model proposed by [2].

Figure 3. Predicted sensory difference over a four octave interval span.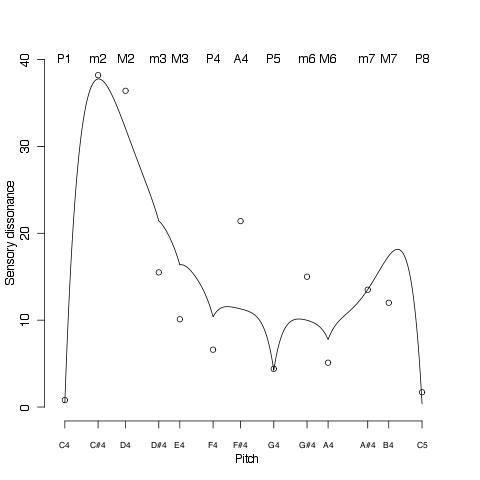

 |
||
|
